Understanding Your 12-Month Cash Flow Report

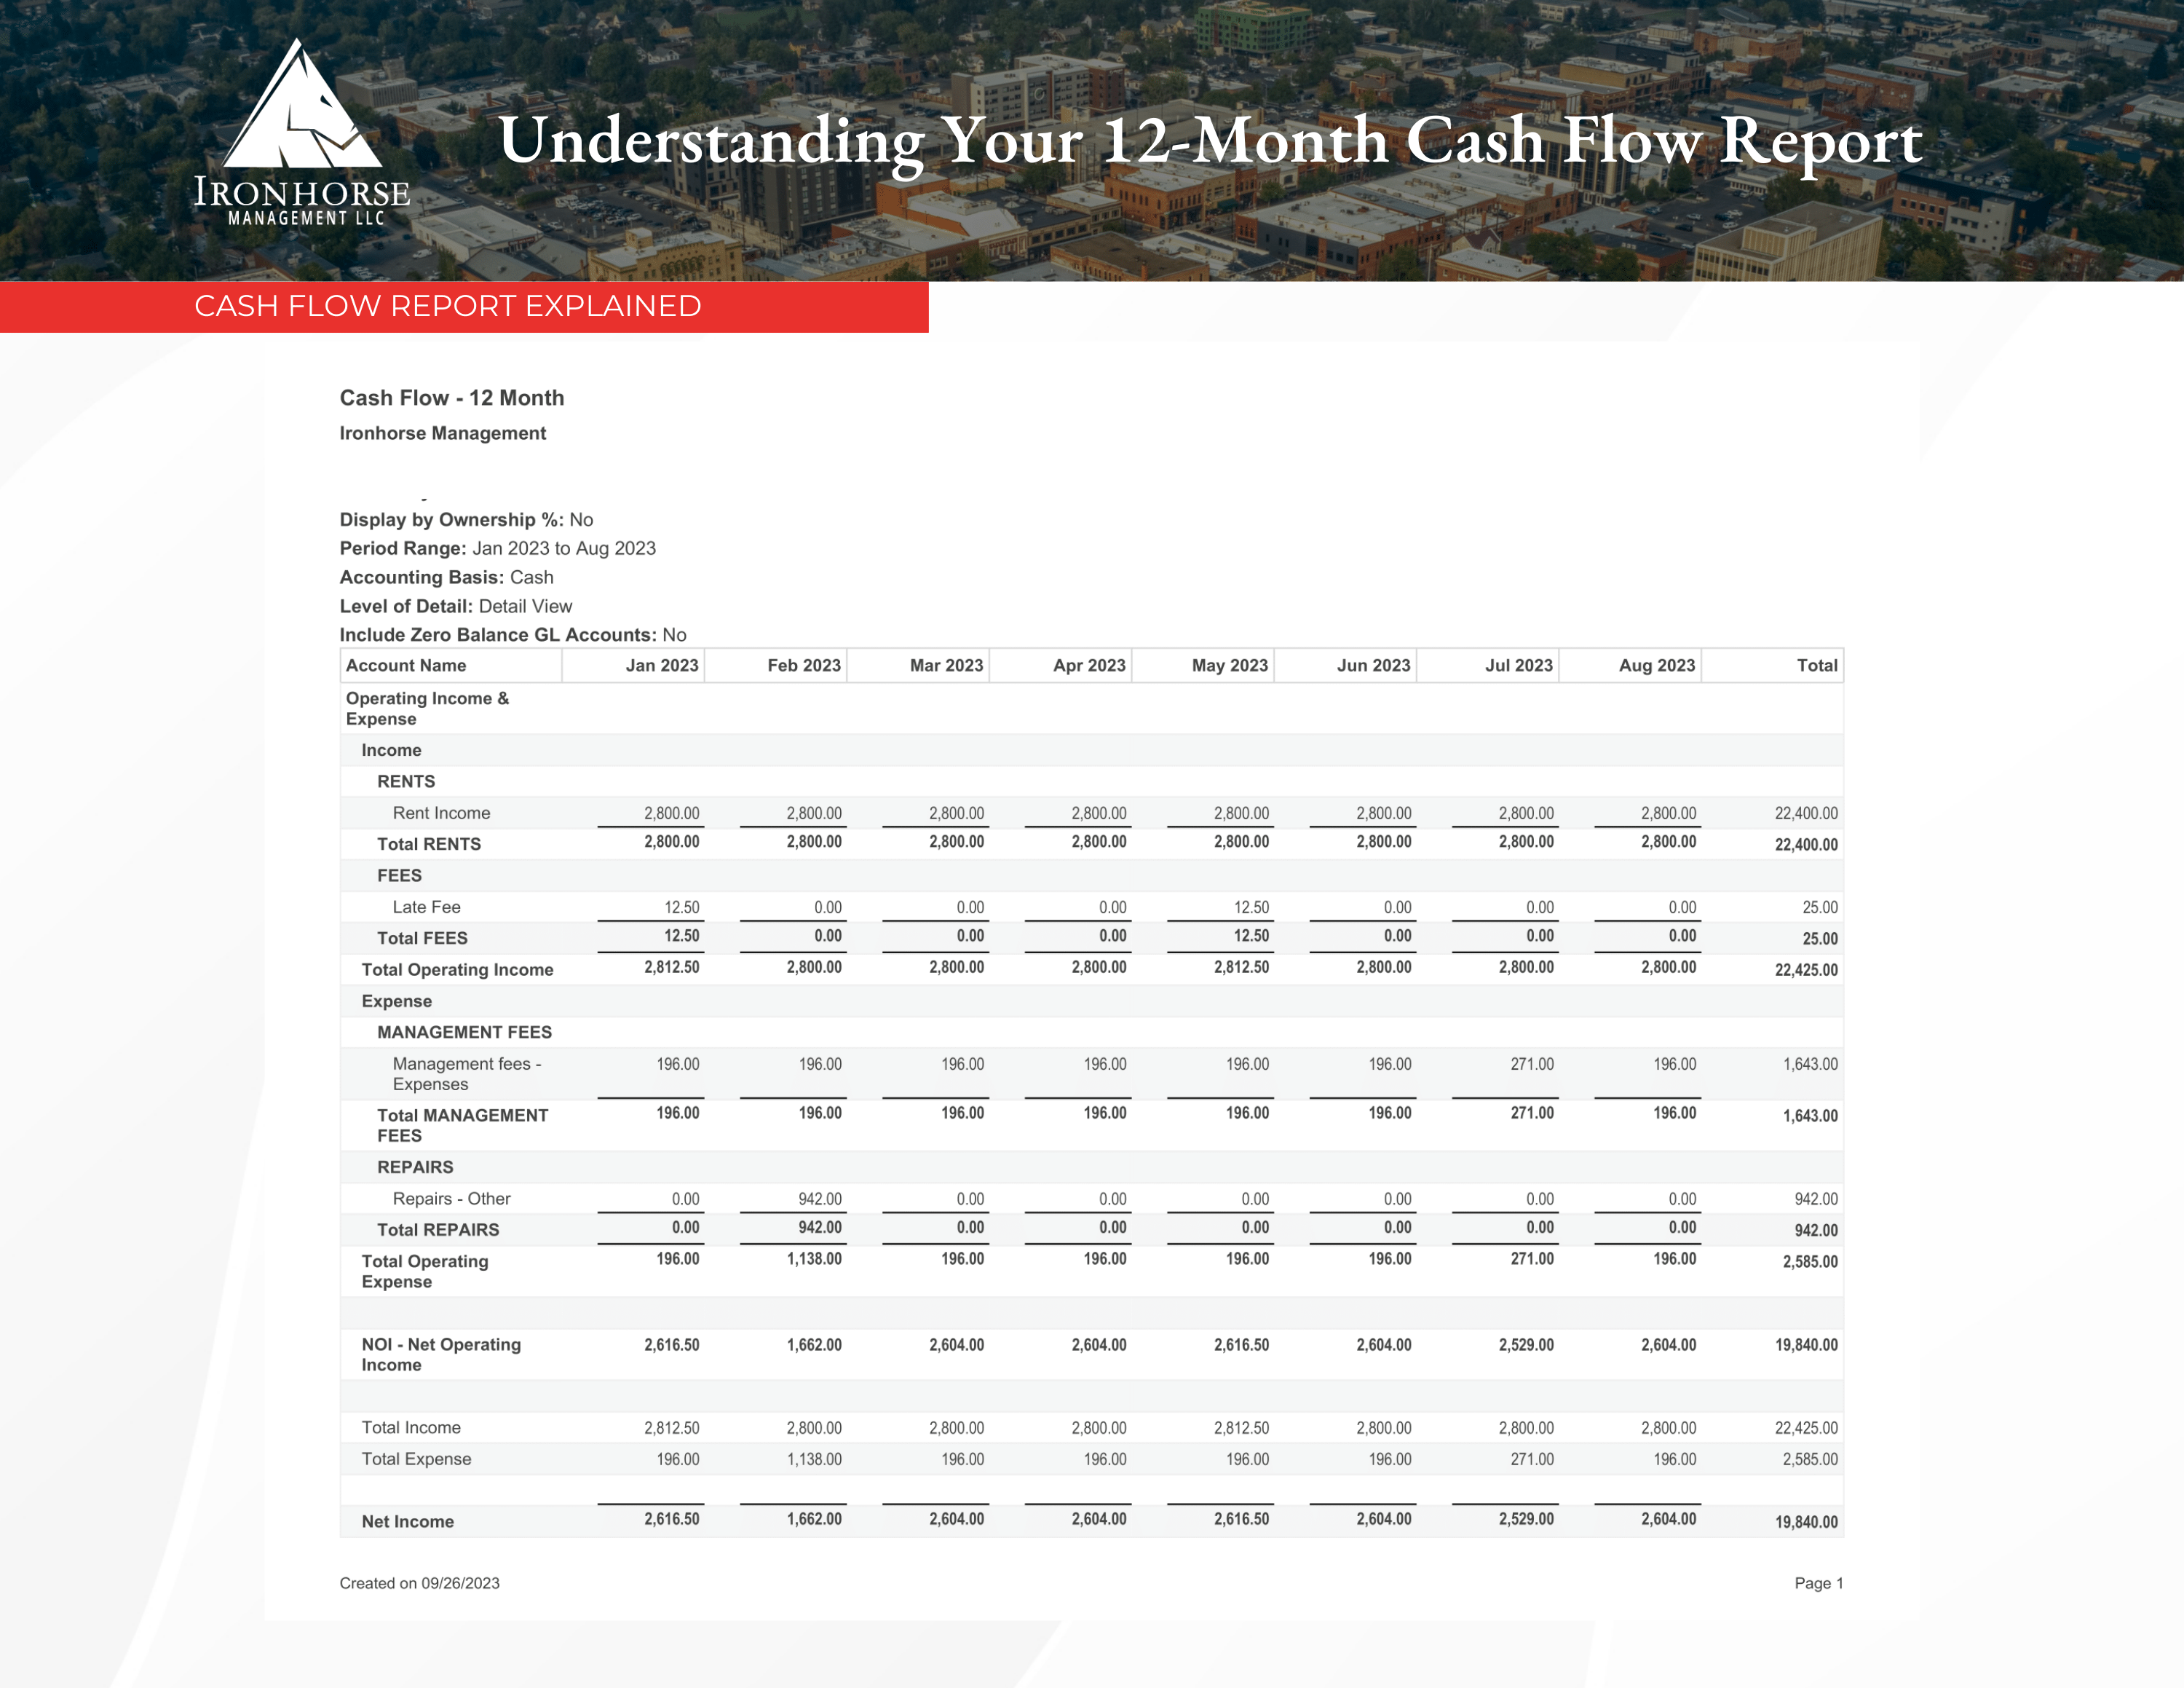
As a property owner, it’s important to understand your 12-Month Cash Flow Report. This report gives you great insight into how your properties have performed over a 12-month time frame. It will give you insights into their financial performance, and help inform your decision making. 

To help you better understand this report, we’ve put together walkthrough guide below.

12 Month Cash flow chart Guide
12 Month Cash flow chart Guide-2
  1. Basic information
    This is where you’ll find your property address, company, and period range of the report.

  2. Operating income & and expenses
    This section shows all income and expenses during the 12-month time period at the respective property address.

  3. Income
    – Rent Income: Total rent collected
    – Late Fee: Fees collected from late payments due from residents

  4. Expense
    – Management fees: Total fees paid to your property management company
    – Repairs: Payments made for repairs and upkeep


  5. NOI – Net Operating Income
    This is your total income from rent and late fees.

  6. Net Income
    This is your total income less total expenses for the time period.

  7. Other items
    – Prepaid Rent: Total rent pre-paid by residents.
    – Owner Distribution: Total disbursements made to you, after income less expenses and fees, and ensuring the cash reserve minimum is met.

  8. Cash flow
    This shows the total cash flow per month.
    – Beginning cash: This is the total cash on-hand at the beginning of each month (typically the cash reserve).
    – Beginning cash + cash flow: This is the beginning cash plus any cash flow obtained during the month.
    – Actual ending cash: This is the total ending cash each month.
 

To keep this document handy, or to print it for your references, you can download this helpful guide using the button below.