
Gallatin County · Market Briefing
Edition: November 2026
Gallatin Rental Market Report
Still soft — but absorbing. A plain-English briefing for rental owners in Bozeman, Belgrade, and nearby Gallatin County.
How To Read This Page. Key findings and large charts appear here. The full 19-page November 2026 PDF is available from the download buttons. Figures come from different data sets and geographies — they are labeled, not mixed. Conditional clearance timings are transparent arithmetic from past-year flows, not guarantees.
01 Gallatin Rental Market Report: Bottom Line For Owners
This Gallatin rental market report finds Gallatin County’s apartment market still soft — but absorbing. The 2025 high in large multifamily vacancy was real; newer public readings show vacancy down from that high while competition at turnover remains. For owners of established units, the practical takeaway is disciplined leasing at turnover — not a reason to treat durable tenancies as a problem.
02 Where This Market Sits
Geography: Gallatin CountyFocus: Bozeman · Belgrade · Four Corners
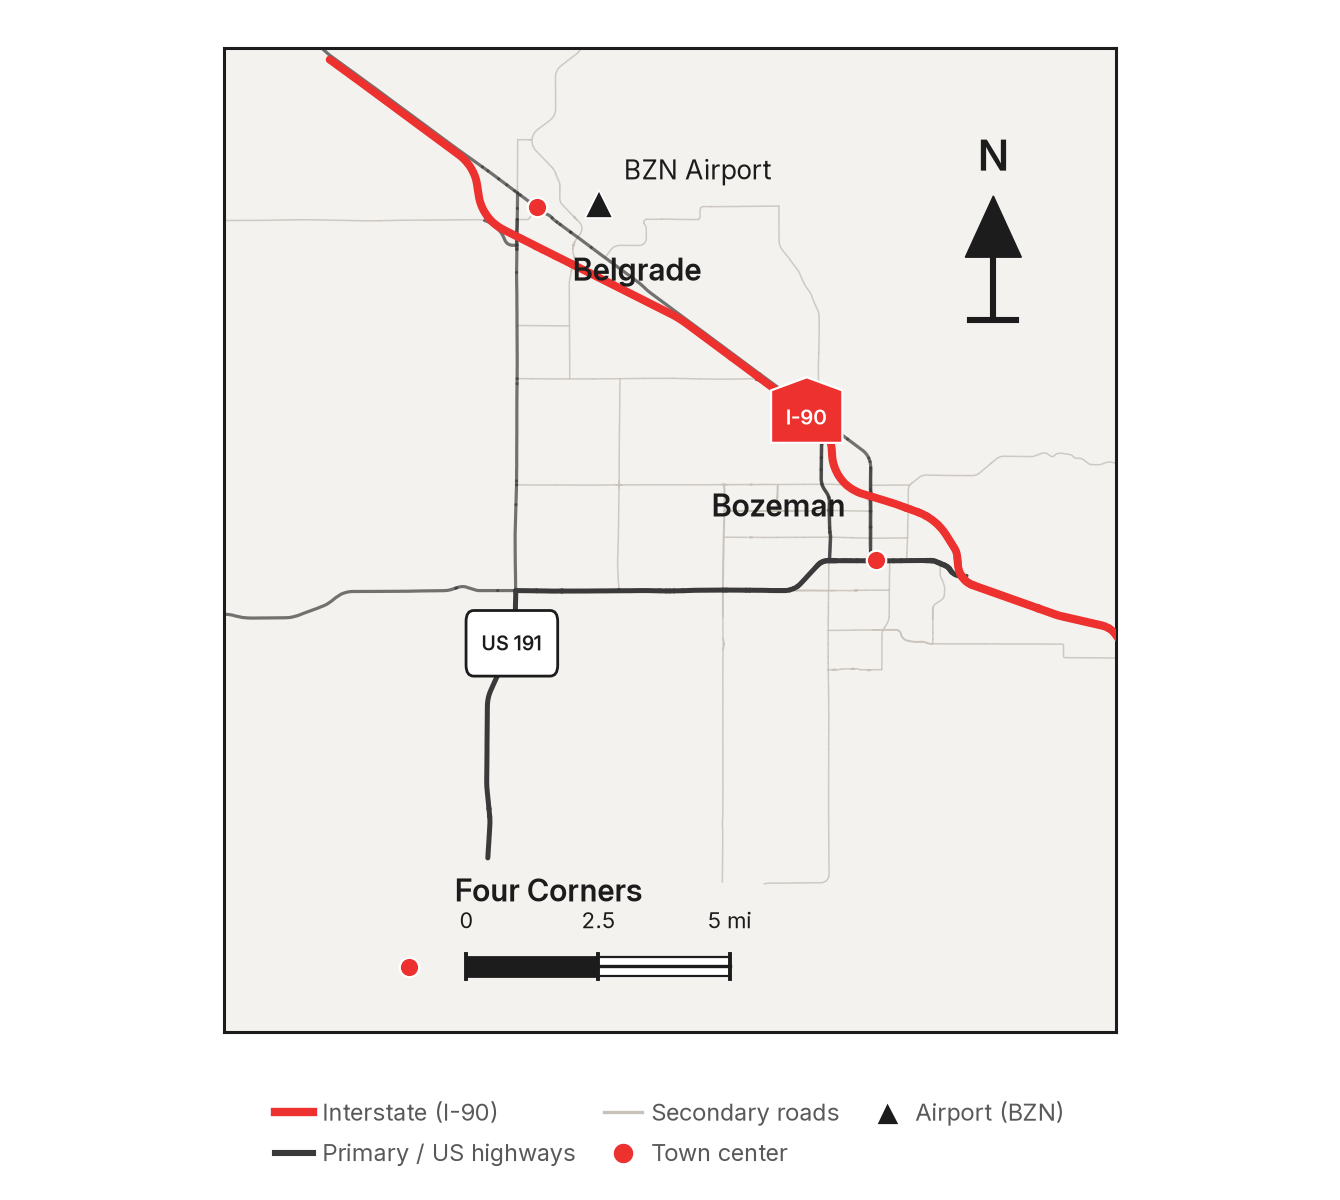
Ironhorse Management’s long-term residential work is focused on Gallatin County — Bozeman, Belgrade, and nearby Four Corners. This briefing stays inside that local market. The map is for orientation only; it is not a property map and does not mark any development sites or Ironhorse locations.
03 The Local Supply Wave
City / EPS · Gallatin MultifamilyAs Of: July–September 2025
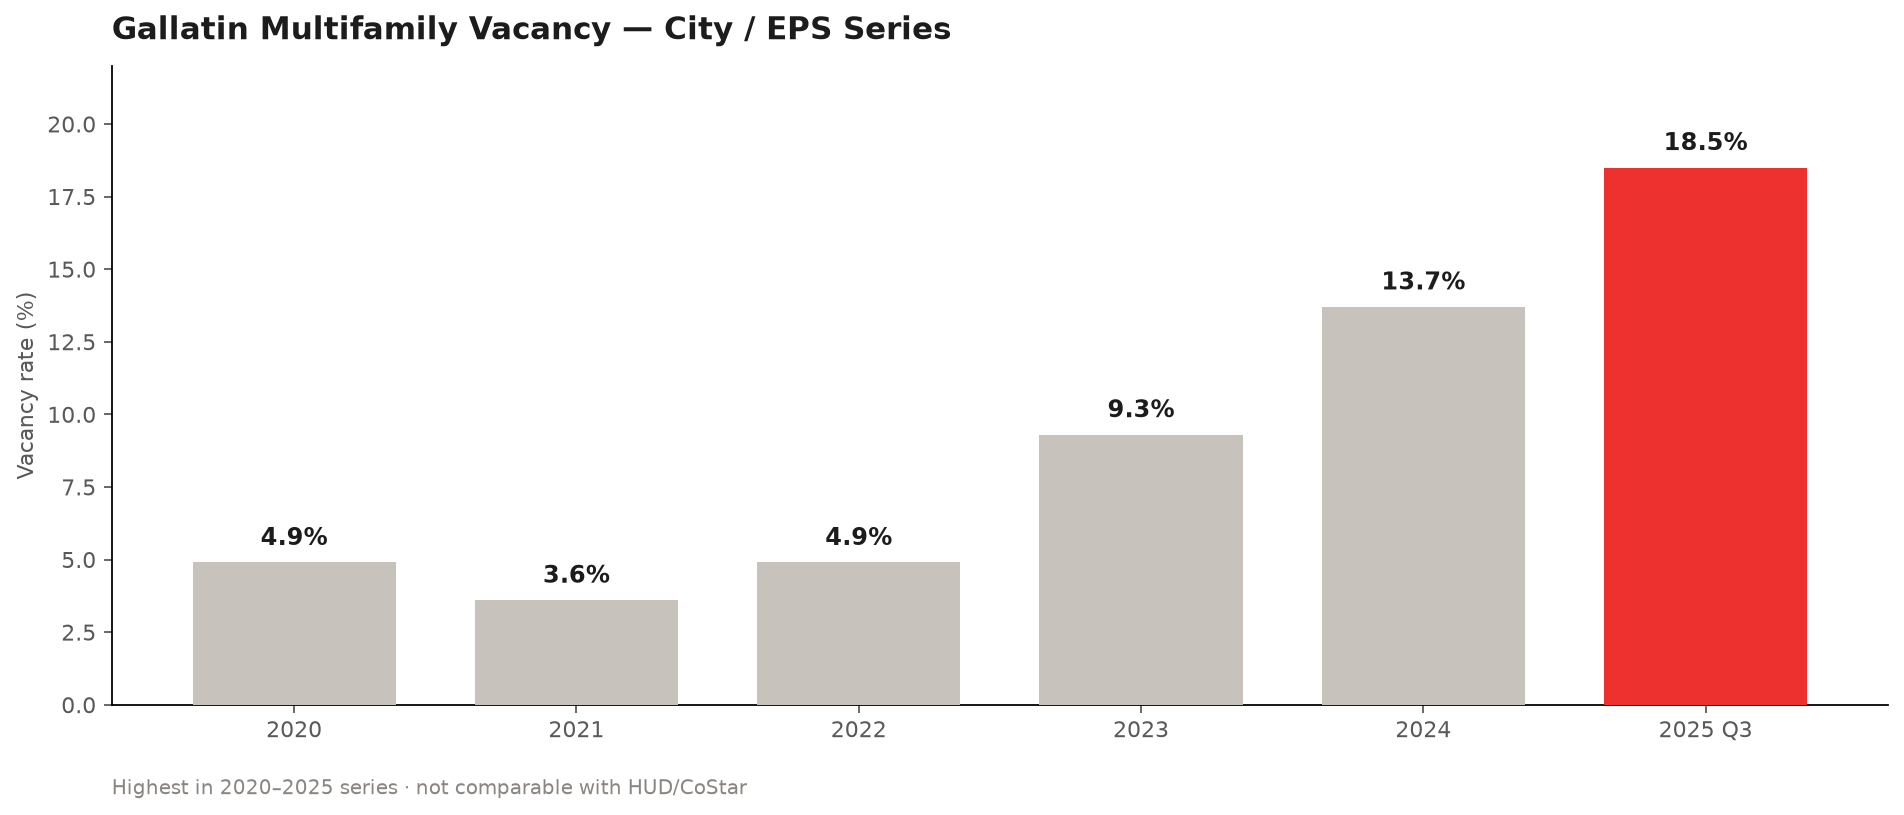
City of Bozeman / Economic & Planning Systems (EPS), published December 2025, shows Gallatin multifamily vacancy reaching 18.5% by July–September 2025 — the highest reading in that 2020–2025 series (not an all-time claim). Large 2024–25 deliveries help explain the wave.
04 Supply Wave — 2026 HUD / CoStar Reading
HUD / CoStar · Bozeman Metro ApartmentsAs Of: April–June 2026
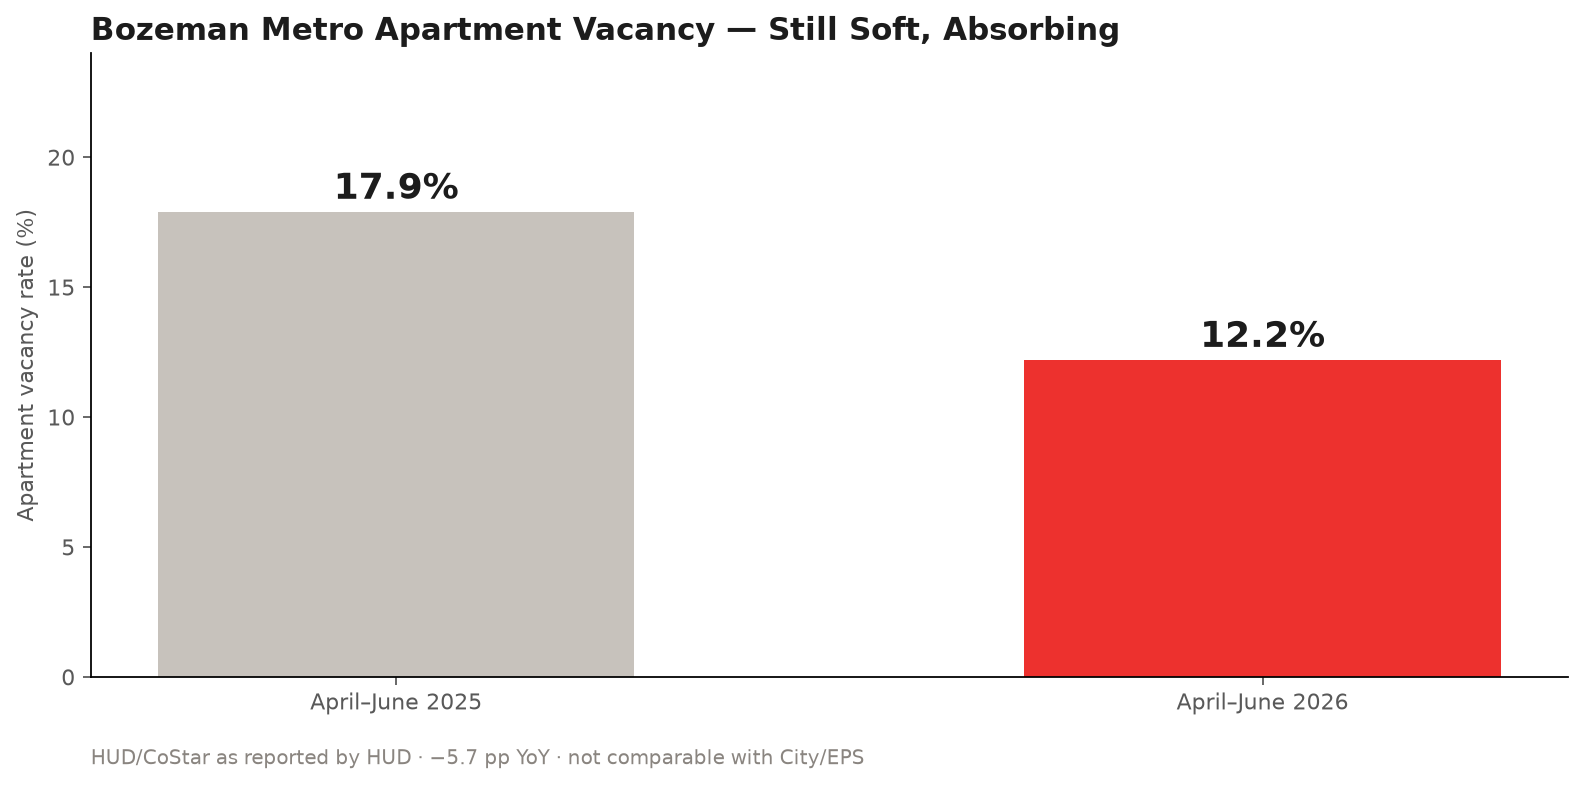
Separate data set from City/EPS. The U.S. Department of Housing and Urban Development (HUD) Rocky Mountain report for April–June 2026 (CoStar apartment data as reported by HUD) puts Bozeman metropolitan statistical area (metro) apartment vacancy at 12.2%, down 5.7 percentage points from 17.9% in April–June 2025. Different data sets — not directly comparable.
05 New Vs. Established Stock
City / EPS Age CohortAs Of: July–September 2025 — Not 2026
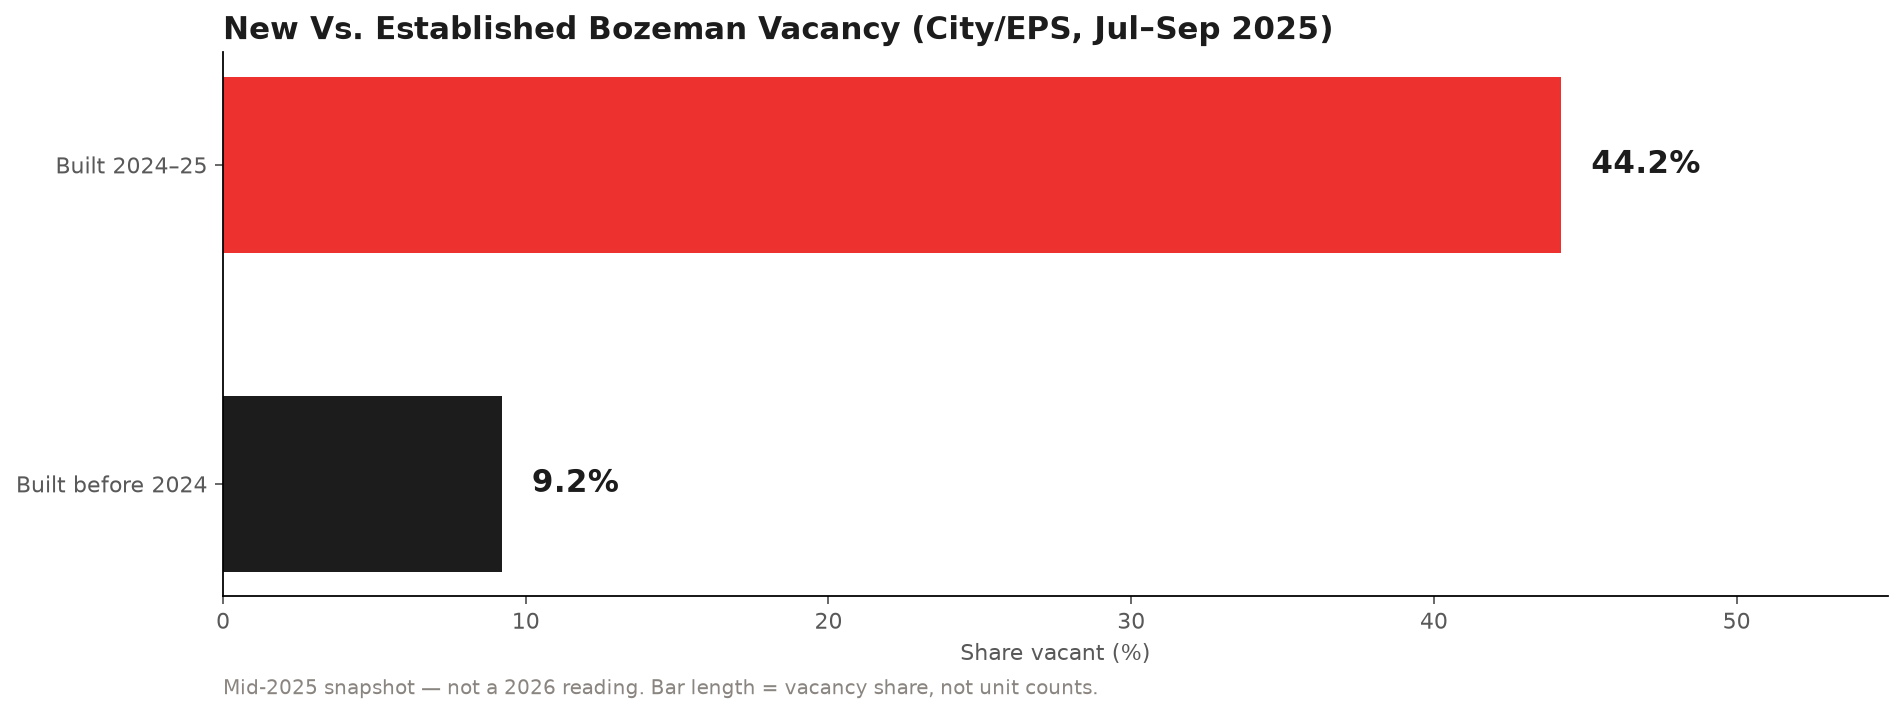
At July–September 2025, City/EPS age-cohort vacancy was 44.2% among Bozeman units built in 2024–25 versus 9.2% among units built before 2024 — a mid-2025 snapshot, not a 2026 reading. Bar length is the vacancy rate (share vacant), not unit counts.
06 2026: Still Soft, Absorbing
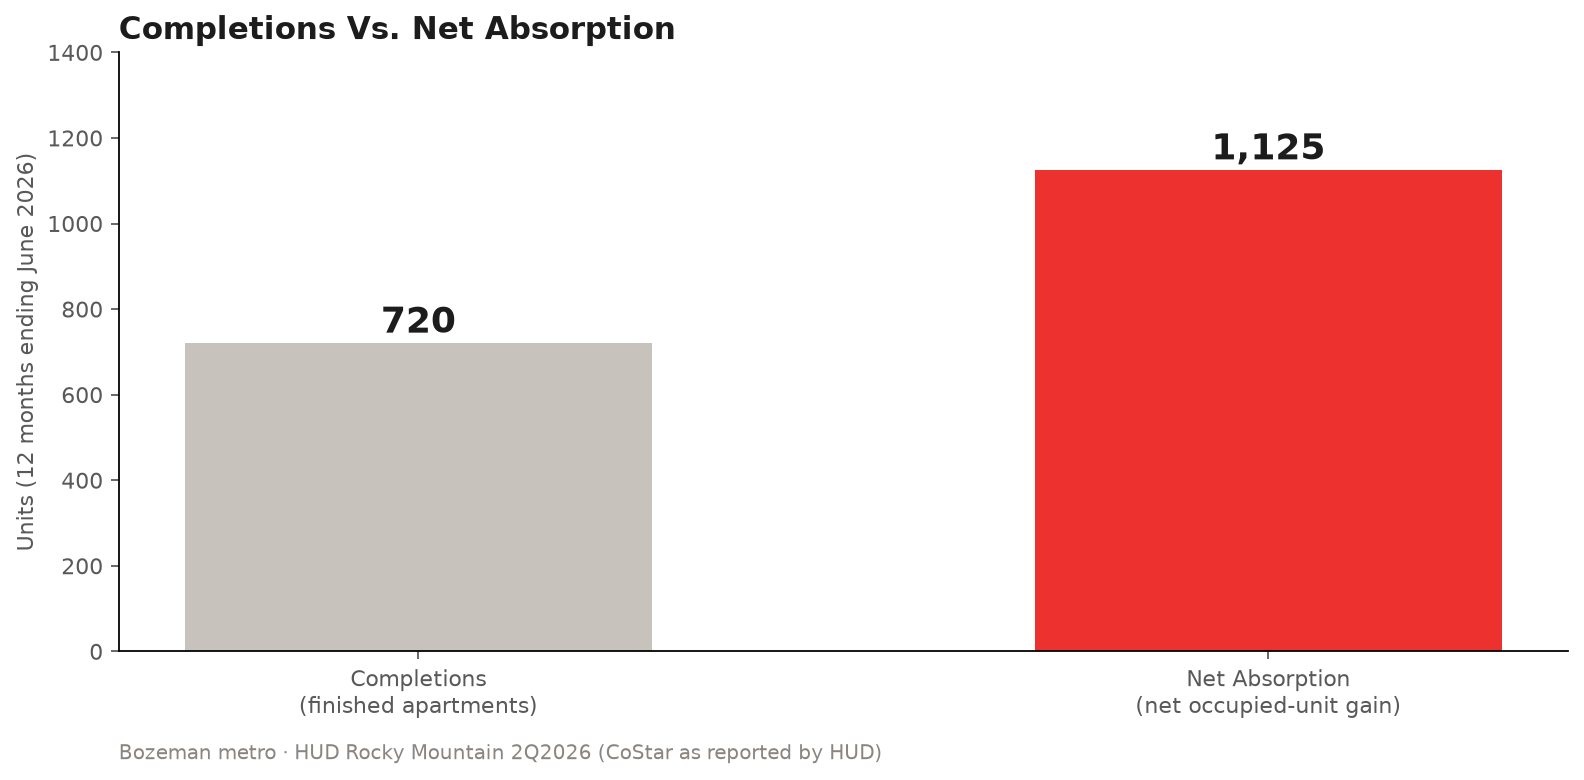
In the 12 months ending June 2026, net absorption (net increase in occupied units) was 1,125 versus 720 completions (finished apartments; completions down 23 percent from the prior 12 months). Average monthly apartment rent $2,162 versus $2,169 a year earlier (published change less than 1 percent down). Occupancy was catching up with a slower delivery pace in that period.
- Census Building Permits Survey (Gallatin County / Bozeman metro), January–September 2026: 1,197 total units authorized (+7.0% year over year); 384 units in buildings with five or more units (−8.6% from 420). These are permit authorizations — not finished apartments.
- Zillow Observed Rent Index (ZORI) asking-rent measure, September 2026: Gallatin County all-homes $2,200.58 (+3.83% year over year); Bozeman metro multifamily $2,018.44 (+4.67% year over year). Asking-rent index — not CoStar average rent and not a vacancy rate.
- Rental Beast listing sample, January–March 2026 (published May 6, 2026): 86.6% of sampled active Bozeman listings offered an incentive; overall days on market averaged 26. Listing-sample estimate — not a census.
Rent Series Are Not Interchangeable. ZORI is an asking-rent index; HUD/CoStar reports average monthly apartment rent; ACS 2025 median gross rent for Gallatin County was $1,825 ±$122. Do not mix those levels.
07 Conditional Estimate — If Trailing Flows Continue
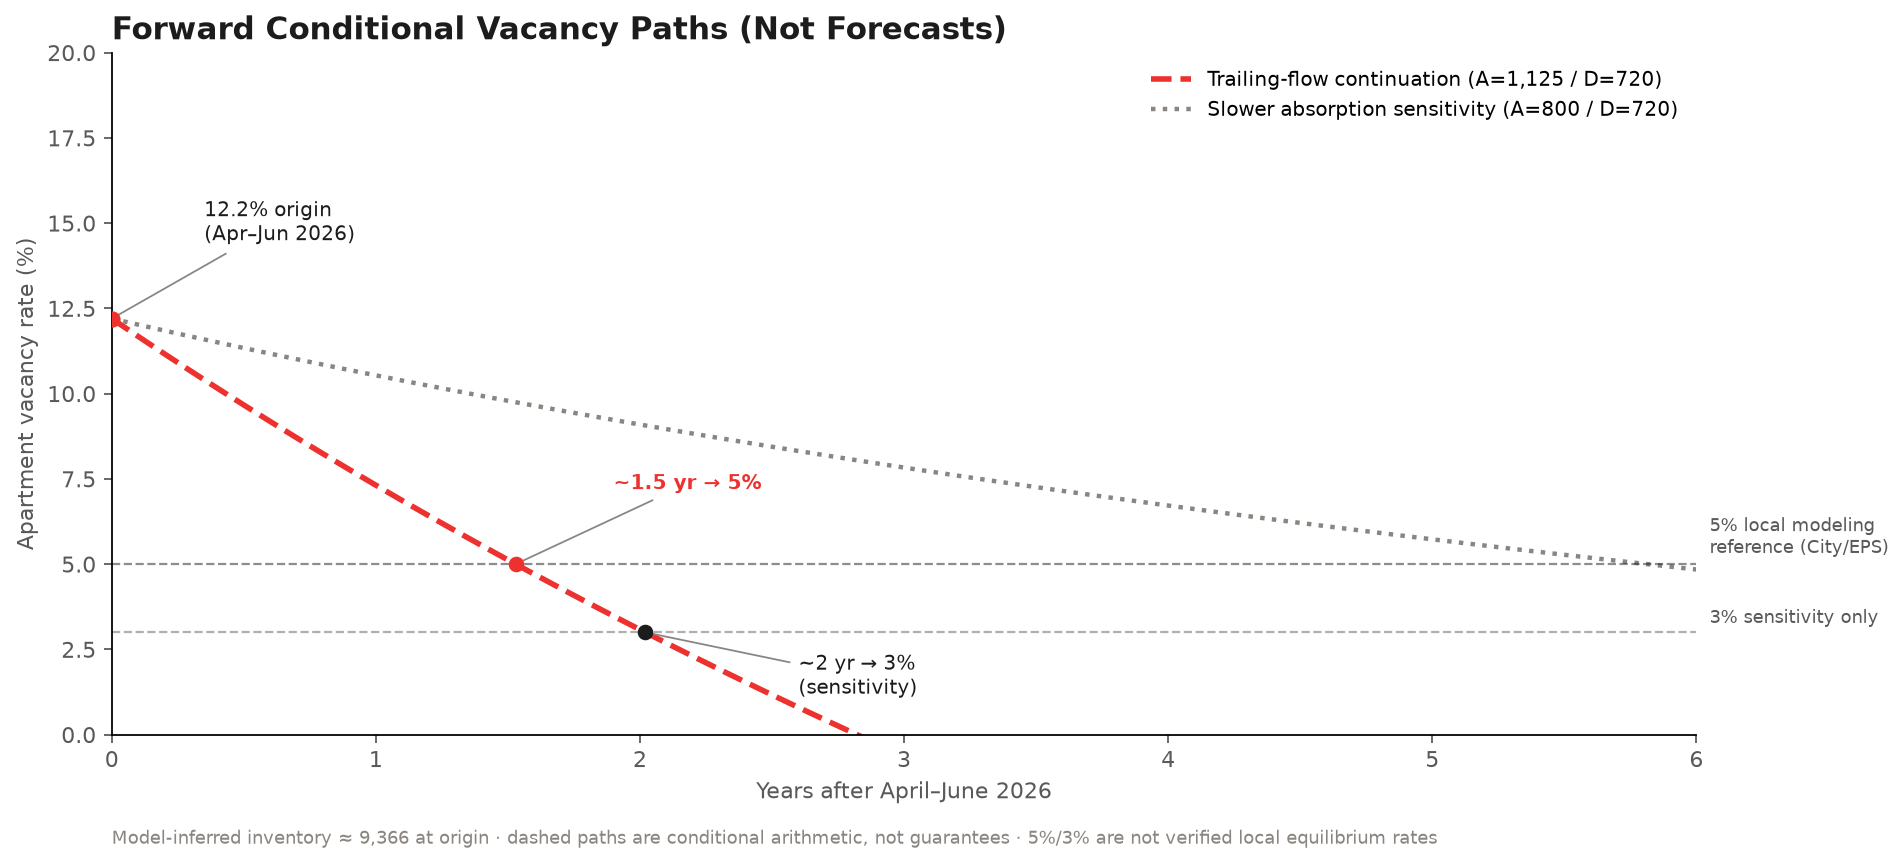
Conditional Normalization Estimate (Not A Guarantee). If the past year’s absorption and completion pattern continues from April–June 2026 (+1,125 net occupied units and +720 net additions per year), a 5% local modeling reference could first be reached in roughly 1.5 years — about late 2027 / early 2028. Under the same flows, a 3% tight-market sensitivity/reference is about 2 years out. Rounded public figures from exact stock-flow arithmetic (about 1.53 and 2.02 years).
How To Read 5% And 3%. Neither 3% nor 5% is a verified equilibrium vacancy rate for Bozeman. 5% is the City of Bozeman / EPS October 2023 normalized-vacancy modeling assumption — a local analyst reference, not an official healthy-market rule. 3% is shown as a tight-market sensitivity/reference for this conditional path, not a claim that 3% is generally healthy or IREM-endorsed. HUD guidance is that each housing market has its own balanced vacancy rate.
A local broker has described roughly 5%–10% as healthy (Montana Free Press, June 2025) — attributed judgment, not ordinance. No annual 2019 vacancy rate was verified. The 2.8% reading at April–June 2020 is early-pandemic, not a pre-pandemic baseline.
Assumptions Used In The Calculation. HUD’s public April–June 2026 table does not publish a matching apartment inventory denominator. The model infers about 9,366 units of inventory at April–June 2026 (and about 8,646 at April–June 2025).
The calculation assumes: (1) the same HUD/CoStar apartment coverage at both dates; (2) the 720 completions equal net stock growth — zero removals; (3) no material reclassification or coverage change; and (4) published rounded inputs treated as exact for this arithmetic.
These market inventory figures are model-inferred for the CoStar/HUD apartment universe — not Ironhorse portfolio counts, and not independently observed Census totals.
Important: This is a transparent conditional calculation from the past year’s HUD/CoStar flows — not a guarantee, not an independently validated forecast, and not investment advice. Future demand, deliveries, financing, household formation, and sample or coverage changes can move actual timing. The clock starts at April–June 2026, not at the date of this page.
08 Conditional Vacancy Path
09 Pipeline — Separate From The Constant-Flow Case
Permitted and planned units are not guaranteed completions. The constant +720 additions case repeats the past year’s HUD completions meter; it does not claim that the full identified pipeline is already baked into that figure.
Identified under-construction (incomplete City of Bozeman snapshot, MMG tracking as of August 19, 2026): Oxbow II 132, Wallace Works 65, Compass 112, and Victoria Flats 82 — 391 units with anticipated delivery windows spanning late 2026 into 2027. Project dates are forecasts, not certified certificates of occupancy.
Separately, City of Bozeman Hidden Creek (~182 affordable units) broke ground May 1, 2026, with leasing anticipated around July 2027. Combined identified minimum: 573 units. MMG also lists 1,414 planned units at conceptual/design stage — not committed construction.
Census Building Permits Survey shows 384 five-plus units authorized January–September 2026 — authorizations, not finished apartments, and may overlap named projects. Pre-lease/lease-up stock delivered in 2025 (about 701 units on the MMG list) is already in trailing inventory, not future supply.
Net Migration Is Not An Extra Absorption Add-On. Census Vintage 2025 puts Gallatin County net migration at 799 people for the year to July 1, 2025 — people, not apartment units. Occupied-unit absorption already reflects demand from migration, household formation, and local tenure shifts.
10 Owner Checklist
- Plan for competitive leasing seasons even while the metro series shows absorption ahead of completions.
- Keep units market-ready before listing; soft markets punish slow turns more than strong ones.
- Protect good long-term tenancies where that fits the owner’s goals — softness is not a reason to churn every lease.
- Read vacancy figures with their geography and as-of date; City/EPS mid-2025 and HUD April–June 2026 are different universes.
- Treat conditional clearance timings as planning context, not a promised recovery date for any single property.
Request A Proposal
Own rental property in Bozeman, Belgrade or elsewhere in the Gallatin Valley? We welcome a conversation about leasing in this market.
References & Limitations
Primary Sources (Summary)
- HUD Policy Development and Research, Rocky Mountain 2Q2026 — Bozeman metro apartment vacancy 12.2% (April–June 2026) vs 17.9% (April–June 2025); 1,125 absorbed / 720 completed (12 months ending June 2026).
- City of Bozeman / Economic & Planning Systems, Bozeman 2025 Economic and Market Update (Dec. 2025) — Gallatin multifamily vacancy 18.5% at July–September 2025; age-cohort 44.2% vs 9.2%.
- City of Bozeman / EPS, 2023 Economic and Market Update — 5% normalized-vacancy modeling assumption (modeling benchmark, not an official equilibrium target).
- Montana Free Press, June 23, 2025 — broker commentary describing roughly 5%–10% as a “healthy” vacancy range (judgment, not official).
- Census Building Permits Survey; Zillow Observed Rent Index (ZORI) county data; Rental Beast Q1 2026 listing sample; MMG Montana July–September 2026 Pipeline Report (tracked Aug 19, 2026); City of Bozeman Hidden Creek (May 1, 2026); Census Vintage 2025.
Important Information
This briefing is general market information for educational and marketing use. It is not legal, tax, accounting, appraisal, or investment advice, and it is not a prediction of future rents, vacancy, occupancy, or returns for any property. Past market results do not predict future results for any property or owner. Conditional scenario timings are assumption-driven and are not guarantees.
Reading this page or contacting Ironhorse Management LLC does not create a management, advisory, or other professional relationship. Terms of any services are set only in a signed written agreement.
Ironhorse Management LLC does not warrant completeness or accuracy of third-party statistics and has not independently audited CoStar, EPS, Census, Zillow, MMG, or other third-party data. Figures are market-level (HUD/CoStar apartment universe where noted), not Ironhorse portfolio counts.
Edition archive: November 2026 (current). Older editions will be listed here after the first refresh. Web page updates are planned quarterly; the full PDF is rebuilt twice a year — both for JD approval before publish.